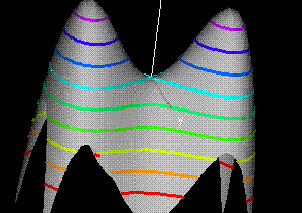
This demo shows a level set consisting of level curves f(x,y) = c for the Twin Peaks function f(x,y) = 3(-x4 + x2 - y2). A contour map is drawn in the window labeled "Domain: f(x,y)". The third window, labeled "Level Curves", allows you to choose a level curve f(x,y) = h by dragging the hotspot along the z-axis. The value of the constant h is shown in the control panel.