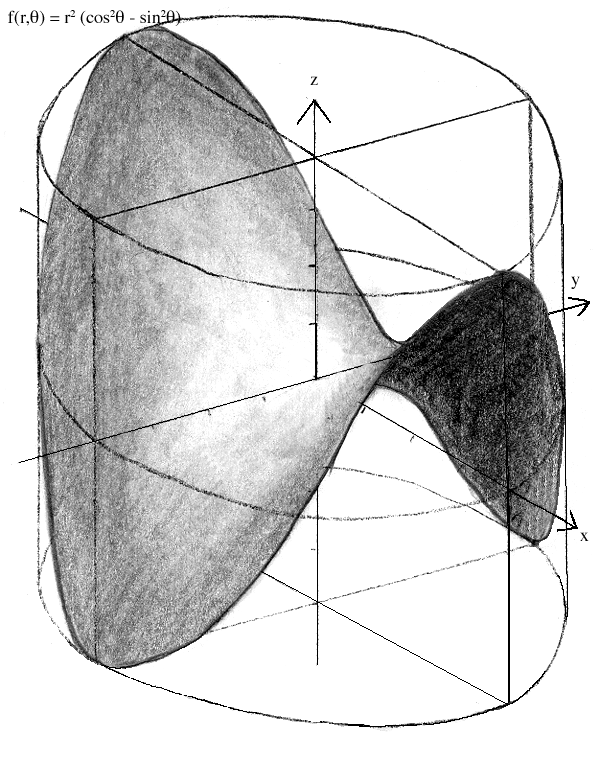
Step 1. Draw x, y, and z axes. It is helpful to draw the x and y axes as if you were looking down on them at an angle. This avoids confusing overlaps in your graph.
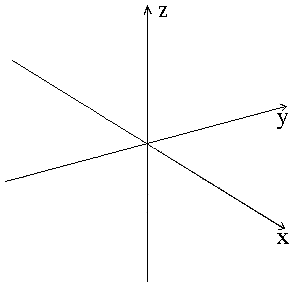
Step 2. Roughly determine the domain of the function you will be graphing. Refer to the What Size Fence 3D? tutorial for help with this step. For now we will assume you are using the unit fence. If you are not, replace the following values with those you wish to use.
Draw the three intersecting planes:
z = 0 , -1 < x,y < 1
y = 0 , -1 < x,z < 1
x = 0 , -1 < y,z < 1
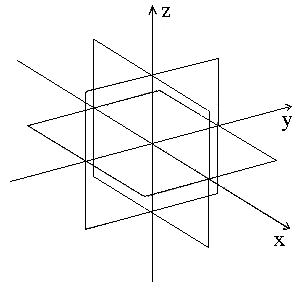
Step 3. Draw the box enclosing the three planes just drawn. After you have completed these first three steps once or twice for yourself, feel free to print out and photocopy this image for future graphing.
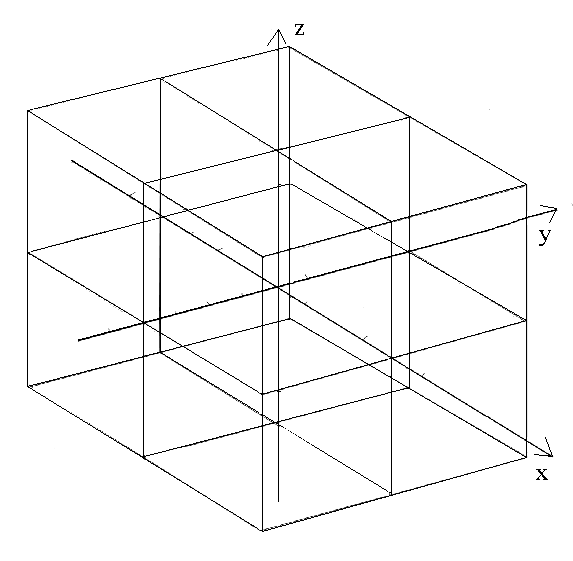
Step 4. Calculate the slice curves for x = 1, 0, -1 and draw them in on the appropriate planes. Refer to PART I. of the Projections and Mappings tutorial for help with mapping planes onto boxes.
Take f(x,y) = x2 - y2 for example.
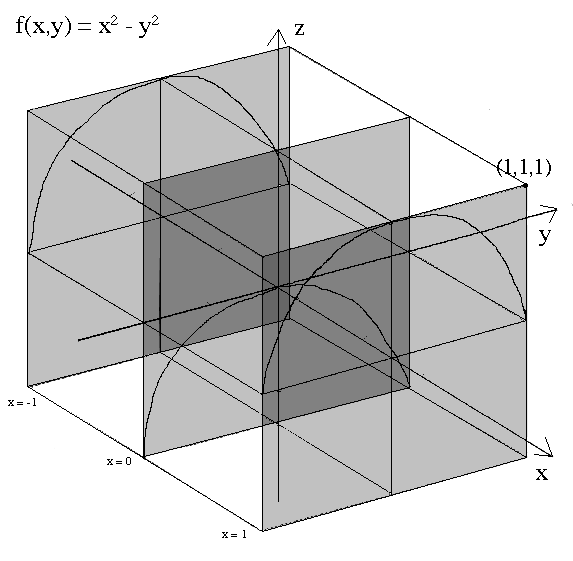
Step 5. Draw the slice curves for y = 1, 0, -1 onto the appropriate planes.
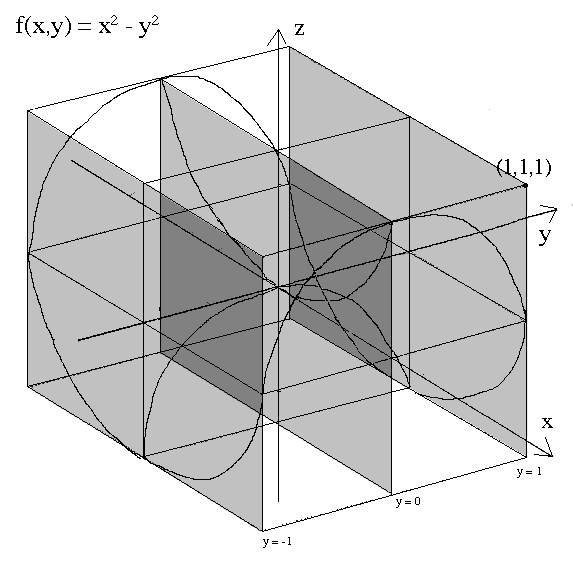
Step 6. Erase the pieces of drawn curves which lie behind other drawn curves in 3-space.
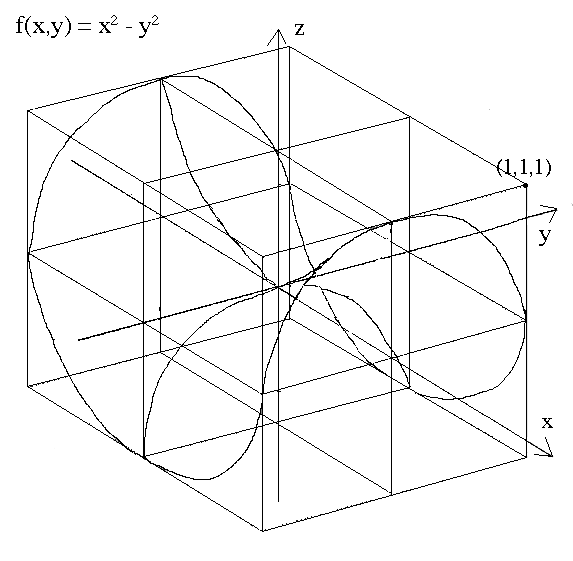
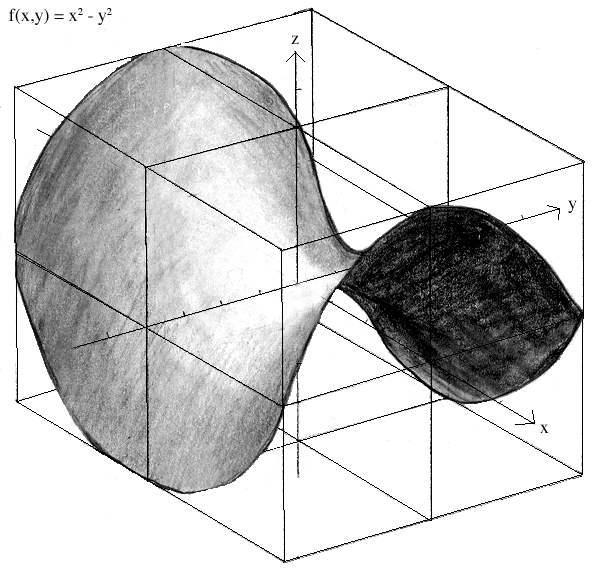
Step 7. Erase inner curves after interpolating the function's shape, then shade realistically. Refer to the Realistic 3-D Shading tutorial for help with this step.
An alternate way of graphing the same function is to translate it into polar coordinateds and graph it using a cylindrical fence. Refer to PART II. of the Projections and Mappings tutorial for help with this.
