Volume Under a Function Graph
1D
3D Polar Coordinates
Contents
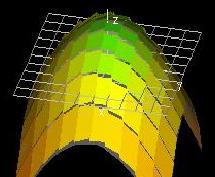
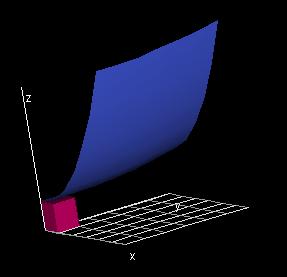
For a functions of one variable, a definite integral represents the
area underneath its one-dimensional function graph. Likewise, the
definite integral of a function of two variables represents the volume
underneath its two-dimensional function graph. 
Recall that the procedure for evaluating single variable integrals
is to
1. Approximate the area under the graph using rectangles, and
2. Take the limit of the sum of the area of these rectangles as the
number of rectangles approaches infinity.
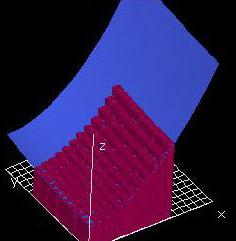
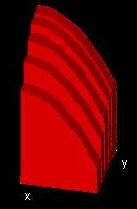
Similarly, the volume underneath the function graph for a double
integral can be found by
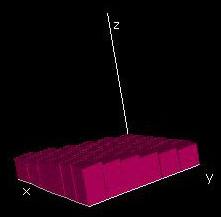
1. Dividing the domain R into rectangles,
2. Erecting rectangular prisms over these rectangles using the value of
the function graph at the bottom-left vertex of each rectangle as the
height,
3. Taking the limit of the sum of the prisms' volumes as the number of
rectangles in the domain aproaches infinity.
Mathematically, this can be stated
∫∫Rf(x,y) dA = limδ→0
Σi=1n f(xi,yi)δxi
δyi.

Exercises
1. For which of the following two functions is the lower sum
a better approximation for the domain 0 ≤ x ≤ 1, 0 ≤ y
≤ 1? Explain your answer.
- f(x, y) = x2 + y2
- f(x, y) = -(x2 + y2)
2. What would happen if there were a large number of
subdivisions (approaches infinity) along the x-axis and a
small number of subdivisions along the y-axis?
How could you go about finding the sum of the volumes of the
rectangular prisms? What if instead there were a large number of
subdivisions along the y-axis and a small number of
subdivisions along the x-axis?
|
Riemann Integral 1D
3D
Top of Page
Contents
A Riemann sum is constructed by dividing a rectangular domain R
into sub-rectangles Rij and multiplying their area
by a height funtion f. This is commonly denoted Sn = Σi,j=0n-1f(cij)(xi+1-xi)(yj+1-yj)
where xi, xi+1, yj, yj+1
are the vertices of Rij and cij
is a point chosen inside of Rij.
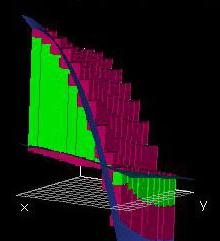
The method for summing the volume
under a function graph described in the previous section used a height
function which took the lowest point on the function graph above the
sub-rectangle, called a lower sum. Similarly, an upper sum
can be used by using a height function which takes the highest point on
the function graph above the sub-rectangle.
A Riemann integral is obtained by letting the number of
divisions in a Riemann sum go to infinity: ∫∫Rf(x,y)dxdy
= limn→∞ Sn.
Exercises
|
1. In single variable
calculus, midpoint Riemann integrals are offered as an alternative to
lower and upper sums. Is there a similar alternative to lower and upper
sums for integrals over two variables?
2. Another alternative to lower and upper sums in single
variable calculus is the trapezoidal approximation. Find an analogous
alternative to the rectangular prisms used in this lab and in lab
2.4.1, and describe this alternative explicitly.
3. What other alternatives to lower and upper sums can you
come up with?
|
Volume between Function Graphs 1D
3D
Top of Page
Contents
Just as we calculated the area between two function graphs c(x) and
d(x) both defined over an interval a ≤ x ≤ b, we
can calculate the volume between two function graphs e(x,y) and f(x,y)
defined over a rectangular domain a ≤ x ≤ b, c ≤
y ≤ d.
More generally, it is possible to integrate over a region in the plane
bounded by the
function graphs of two functions
c(x) and
d(x) both
defined on an interval
a ≤ x ≤
b.
An approximation of this domain can
be obtained by subdividing a ≤ x ≤ b into n
subintervals and c(xi) ≤ y ≤ d(xi) into m
subintervals.
The volume underneath f(x,y) for this non-rectangular region
can be calculated using itererated integration with x ranging
from a to b and y ranging from c
to d.
In the more general case,
given
that the limits of
integration for y are dependent on x, the dy
integral must be evaluated first, giving
∫ab ∫c(x)d(x) f(x,y)
dydx.
Exercises
|
1. How could you modify the problem addressed in this lab so
that it only involves one function, instead of two?
2. Find two functions of x and y which enclose a region whose
volume is finite (i.e. they intersect to form a closed curve).
|
Change of Order of Integration
3D Polar Coordinates
Top of Page
Contents
Fubini's Theorem states that for a continuous function of x
and y with a rectangular domain, one can evaluate a double
integral by first integrating with respect to x (treating y
as a constant) and then integrating this result with respect to y
(treating x as a constant), or by first integrating with respect to y
(treating x as a constant) and then integrating this result with
respect to x (treating y as a constant).
Formally, for a function f(x, y) with domain R
such that a ≤ x ≤ b, c ≤ y ≤ d,
∫ab∫cdf(x, y)dydx = ∫cd∫abf(x,
y)dxdy = ∫∫Rf(x, y)dA
Exercises
|
The "Slab
Approximations" demo description mentions that the series of slabs
represents the summation of an integral. Would it be possible instead
to take the integral of a summation and get the same result? Compare
and contrast these two processes.
|
Surface Area for Function Graphs 1D
Top of Page
Contents
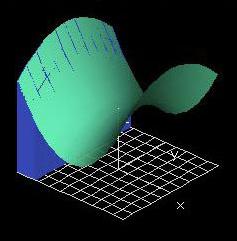
If a function is differentiable, then one can approximate the graph of
the function close to any point as the tangent plane to the graph at
that point.
Recall that the tangent plane to a
graph of f(x,y) at some point (x0,y0,z0)
is given by z - z0 = fx(x0,y0)*(x
- x0) + fy(x0,y0)*(y - y0).
We can approximate the area of a function graph by finding the area of
a set of parallelogram-shaped fragments of tangent planes, which we
will refer to as "shingles", all of which project onto rectangles of
area dx * dy in the x-y-plane.
The first step in finding the
area of a shingle is to find the vectors which describe the sides of
this shingle, one must consider what happens as one moves along a
tangent plane to a point some distance either in the x or y direction
from the point.
If one moves a distance dx in the x direction, the resulting
vertical displacement will be fx(x0,y0)*dx.
The vector for the resulting side of the shingle, then, is (dx, 0,
fx(x0,y0)*dx).
Likewise, movement a distance dy in the y direction will generate
the vector (0, dy, fy(x0,y0)*dy).
In general, we can find the area of a parallelogram by taking
the magnitude of the cross product of the vectors which describe its
sides.
The cross product of (dx, 0, fx(x0,y0)*dx)
and (0, dy, fy(x0,y0)*dy) is
(fx(x0,y0)dxdy, -fy(x0,y0)dydx,
dxdy), so the magnitude is √((fx(x0,y0)dxdy)2+
(-fy(x0,y0)dydx)2+ (dxdy)2)
=√(fx(x0,y0)2+fy(x0,y0)2
+1)dA.
The last step is to integrate the area of shingles over some domain D
to get the formula for the surface area of a graph:
A(S) = ∫∫D√(fx(x0,y0)2+fy(x0,y0)2
+1)dA
Exercises
|
In the default example
(paraboloid), which approximation is greater: the area of 1 shingle
(resolution 1), or the total of the areas of 100 shingles (resolution
10)? You do not need to calculate.
|
Change of Variables 1D
3D
Top of Page
Contents
Integration in a non-Cartesian coordinate system requires an
application of the Change of Variables Theorem.
Consider what would happen for a
function of two variables. Up until now, we have integrated over two
variables by adding up volumes of rectangular prisms with heights f(x,
y) and rectangular bases of area dx * dy. If we decide
to express x and y as functions of variables u
and v, we need to find some new expression for the volume of
the differential.
The height will still be the value of the function, expressed as f(x(u,v),
y(u,v)).
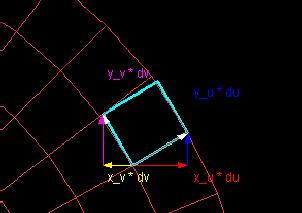
The base of the volume will be a parallelogram. The two vectors
representing the sides of this parallelogram are based on what happens
when u and v change. When u changes by
some amount du, x increases by xu*du
and y increases by yu*du. The resulting
vector is (xu * du, yu * du).
The other vector, which is based on what happens when v
increases some amount dv, is (xv * dv, yv
* dv).
To find the area of this base, take the cross product of the
vectors, which is equal to
(xuyv - xvyu)dudv.
Finally, multiply by hieght to get the Change of Variables Theorem
for double integrals:
∫∫Df(x, y)dxdy = ∫∫D*f(x(u, v), y(u, v))(xuyv
- xvyu)dudv,
Where D is the domain in Cartesian coordinates and D*
is the domain in the new coordinate system.
Note that the expression
(xuyv - xvyu)
is the determinant of the matrix with rows
(xu, xv), (yu, yv).
Exercises
1. Find the change of variables formula (i.e. form of ∫∫Df(x,
y)dxdy = ∫∫D*f(x(u, v), y(u, v))(xuyv
- xvyu)dudv) for each of the following
coordinate systems:
- x(u, v) = (u - v)√(2), y(u, v) = (u + v)√(2)
- x(u, v) = ucos(v), y(u, v) = usin(v)
(polar coordinates)
- x(u, v) = u2 - v2, y(u,
v) = 2uv
2. Under what conditions will the cyan parallelogram shown in
the "D" window have constant area for all (u, v)?
|
Total Mass of a Region in the Plane 1D Polar Coordinates
Top of Page
Contents
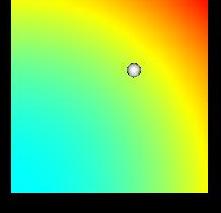
The mass of an object is calculated by integrating its density
function over the region of the domain that it occupies.
For a density function ρ(x,y)
of two variables and an object in the domain of ρ occupying a
region R, the mass is
∫∫Rρ(x,y) dA.
Examples
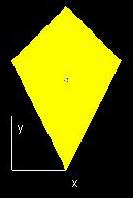
The Mass of an Object with Density ρ(x,y) = 4x + 8y
What is the mass for an object with density ρ(x,y) = 4x + 8y
defined over a triangular region with vertices (0,0), (2,1),
and (1,0)?
This region can also be defined using the intervals 0 ≤
x ≤ 2 and 0 ≤ y ≤
0.5x. Using the technique of
iterated integration for a region bounded by a function graph of x
gives
M = ∫∫Rρ(x,y)dA = ∫02∫0.5x 4x+8ydydx = ∫02[4xy+4y2]0.5xdx = ∫02 3x2 dx = [x3]02 = 8.
Note that the units of measurement of this value would be determined by
the units of the
ρ function.
Exercises
|
Will the double
integral of rho over this square region find the mass of a
three-dimensional object? Explain. Is there a way to modify the double
integral to find the mass of a cubic region R determined by 0
≤ x ≤ 1, 0 ≤
y ≤ 1, 0 ≤ z ≤
1 using the same density function ρ(x,y)?
Consider a density function of three variables. What would
the
triple integral of the density function represent? Could the mass be
visualized as the volume underneath the function graph of the density
function? What is the dimension of the space in which the function
graph would exist?
|
Center of Mass 1D
3D
Top of Page
Contents
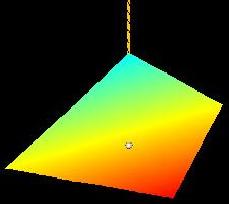
The center of mass of a two-dimensional region is a weighted average of
the positions of the particles that the region comprises. The amount
each particle counts in this weighted average is proportional to its
mass.
If we wanted to find the average
position of a series of particles, we could find each coordinate of the
point representing average position by adding up the values of that
coordinate from each point and dividing by the number of points. For
example, to find the x coordinate X in the average position of n
particles, we would calculate
(Σnxn)/n
Where xn is the x coordinate of the position of
the nth particle.
Suppose instead we wanted to find the center of mass of a region as
described in the first paragraph. Our expression for the x
coordinate of the center of mass, given the mass mn
of each particle is:
(Σnxnmn)/(Σnmn)
(Note that the denominator is equal to the total mass of the set of
particles.)
Given an area density function ρ(x, y), we can express
this summation as
(Σnxn*ρ(xn, yn)*An)/(Σnρ(xn,
yn)*An)
Where An is the area of the nth particle.
For a region with domain D composed of a very large number
of particles, we can change this summation to a double integral,
replacing An with dA:
X = (∫∫Dx*ρ(x, y)dA)/(∫∫Dρ(x, y)dA).
Similarly, to find the y coordinate of center of mass,
use:
Y = (∫∫Dy*ρ(x, y)dA)/(∫∫Dρ(x, y)dA).
This gives us the center of mass (X, Y) of D.
Exercises
|
1. Does the center of mass change if the density function is
multipied by some constant k? Why or why not?
2. Find a region and some density function ρ(x, y)
such that the center of mass lies outside the region. In general, what
geometric property must a region have for its center of mass to be able
to lie outside of the region?
|
Moment of Inertia
3D
Top of Page
Contents
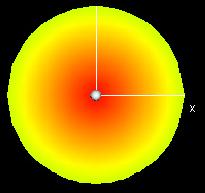
The moment of inertia I of an object about an axis of rotation is a
value which indicates the resistance of that object to changes in
rotation about that axis. For a region D in the plane with area density
ρ(x, y), this calculated using the following formula:
I = ∫(r(x, y))2ρ(x, y)dxdy
Where r(x, y) is the distance of the point (x, y)
from the axis of rotation. In the two-dimensional case, this axis is a
point.
For an object of density 1, the moment of inertia will be the
density multiplied by the integral
I = ∫(r(x, y))2dxdy.
Exercises
|
1. Find the moment of inertia of a circle of radius 1 and
uniform density 1, rotated about its center.
2. Find the moment of inertia of a circle of radius R,
uniform density, and total mass M, rotated about its center.
3. Find the moment of inertia of a circle of radius R,
uniform
density, and total mass M, rotated about a point P which is displaced
by (x0, y0) from the center of the
circle.
4. What formula can you suggest which relates the moment of
inertia of an object rotated about a point A to the moment of inertia
of the same object rotated about a different point B?
|