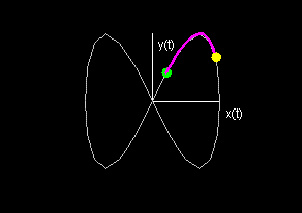
For a parametrized curve (x(t),y(t))
in the plane, the x-level set at
level k is the set of points in the domain with x(t) = k and similarly for the y-level set at level k. The
points (x(t),y(t)) with x(t) = k form the x-contour at height k and
similarly for the y-contour at
height k.
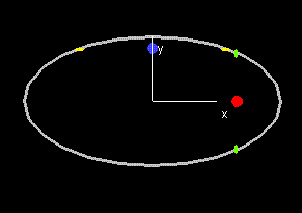
In the default example
in the demo above, start the red hotspot to the left of the
parametrized curve and slowly move it to the right so that it ends up
to the right of the curve. Describe what happens during this motion.
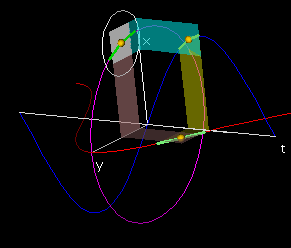
If the coordinate functions x(t) and y(t) are
continuous
functions of the parameter t, then the function that sends t
to (x(t), y(t)) is continuous at t0 if for every ε > 0 there is a δ > 0 such that (x(t0), y(t0)) lies within ε of (x(t0), y(t0)) if | t - t0 | < δ.
This means that for any t0
in the domain,
and any positive ε, there is a δ such that (x(t),y(t))
is
within the disc of radius ε about (x(t0),y(t0))
whenever | t - t0 | is less than δ. We
achieve this by choosing δ so
small that | x(t) - x(t0) | < ε/2 and |
y(t) - y(t0) |
< ε/2, by virtue of the continuity of x(t) and y(t)
at t0.
Then √((x(t)-x(t0))2 + (y(t)-y(t0))2)
< √(ε2/4 + ε2/4)) = ε/2 < ε
if | t - t0 | < δ.