Linear Functions 1D 2D
Contents
Calculus is the study of functions.

Functions of three variables are
similar in many aspects to those of two variables. One primary
difference, however, is that the graphs of functions of more than two
variables cannot be visualized directly, since they have dimension
greater
than three. However, we can still use slice curves, slice surfaces,
contours, and level
sets
to examine these higher-dimension functions.
The simplest functions are constant functions and linear
functions. 
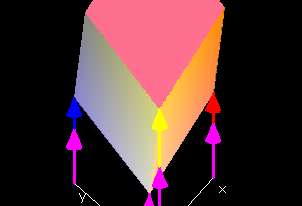
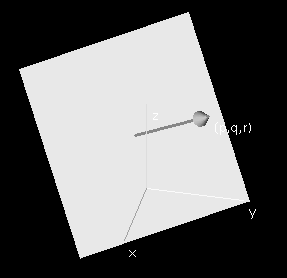
When we describe a hyperplane as the graph of a linear function
f(x,y,z) = px + qy + rz + k, we are giving a special role to the
origin. Often it is more convenient to consider planes through a
particular point (x0,y0,z0,w0)
in space, and we can describe such a
plane with x-slope p, y-slope q, and z-slope r by the condition w-w0
=
p(x-x0) + q(y-y0) + r(z-z0).
Choosing different values of the
slopes p, q, and r, we obtain all non-vertical hyperplanes through
(x0,y0,z0,w0).
Examples
The Zero Function 
The simplest function of all is the zero function, defined
by f(x,y,z) = 0 for all x, y, z. This function can
be defined for any domain, and the range will always always be the
single point {0}. 
Constant Functions 
The next simplest class of functions are the constant functions
defined by f(x,y,z) = k for all x, y, z. A constant
function can be defined for any domain, and the range will always
always be the single point {k}. 
Linear Functions 
Linear functions are the next most simple class of functions,
defined
by L(x,y,z) = px + qy + rz + k for constants p, q, r,
and k. The numbers p, q and r are called
the
x-slope, the y-slope, and the z-slope
of the linear
function and k is called its w-intercept.
The natural domain of the
linear function L is all triples (x,y,z) of real
numbers. If p ≠ 0 or q ≠ 0 or r ≠ 0, then
the range of L is all real numbers. 
Exercises
|
1. Show that if p ≠ 0, then for every w
there is a point (x,y,z) such that L(x,y,z) = px + qy +
rz + k = w. Show that if q ≠ 0 or r ≠ 0, then
the same result holds.
2. Consider the tetrahedron with vertices at the x-intercept,
y-intercept, z-intercept, and w-intercept
(i.e. x = y = z = 0) points of the graph of L(x,y,z) =
px + qy + rz + k. For what values of p, q, r, and k
does this tetrahedron intersect the graph of L(x,y,z) over
the domain 0
≤ x
≤ 1, 0
≤ y
≤ 1, 0
≤ z
≤ 1?
|
Domain, Range & Function Graphs 1D 2D Cylindrical
Coordinates Spherical Coordinates
Parametric
Equations
Top of Page
Contents
Three-Variable Calculus considers functions of three real variables.

A
function f of three real
variables assigns a real number f(x, y, z) to each set of
real numbers (x, y, z) in the domain of the function. 
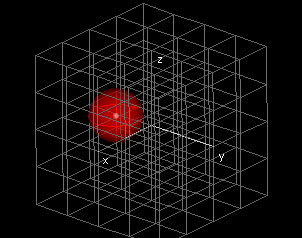
The domain of a function of three variables is a subset of
coordinate 3-space { (x,y,z) | x, y, z ∈ {R} }.

The most common
domains are rectangular prisms of the form a ≤ x ≤ b, c ≤ y ≤
d, e ≤ z ≤ f. Other common domains are the cube centered around a
point
(x0,y0,z0) with radius δ
given by x0 - δ ≤ x ≤
x0 + δ, y0 - δ ≤ y ≤ y0 + δ, z0
- δ ≤ z ≤ z0 + δ and the
ball centered around (x0,y0,z0)
with radius δ given by √(x-x0)2+(y-y0)2+(z-z0)2
≤ δ

The range of a real-valued function f is the
collection of all real numbers f(x,y,z) where (x,y,z)
is in the domain of f. 
The
simplest example of a function
is the constant function that assigns the real number k
to all (x,y,z) in the domain. The range of this function is
the set {k} containing one point. The next simplest example
is a linear function defined by the formula f(x,y,z) = px
+ qy + rz + k where p, q, and r are the partial
slopes of the linear function and k denotes its
w-intercept.. The range of this function is all real
numbers if p, q, and r are not all zero,
and just the value {k} if p = 0, q = 0,
and r = 0. 
The graph of a function of three variables is the
collection of points (x,y,z,f(x,y,z)) in 4-space where (x,y,z)
is in the domain of f. 
As
mentioned before, the graph of a
function of 3 variables is a 3-dimensional hyperplane lying in 4-space.
Therefore the graph cannot be visualized directly; the domain itself is
already three dimensional. 
Exercises
|
1. What is the range of the function f(x,y,z) = ax2
+ cy2 + ez2? (The answer will depend on the
constants a, c, and e.)
2. What is the range of the function f(x,y,z) = -x4
+ 2x2 - y4 + 2y2 - z4 + 2z2
?
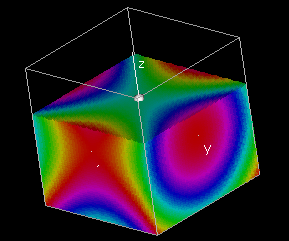
3. In the next demo, whereas every point p in the
cube domain -1
≤ x, y, z
≤ 1 gets assigned a color
according to its function value f(p),
it is only possible to view the colors that appear on the faces of the
cube. When is the range of the colors on the faces the same as the
range on the inside of the cube?
4. More generally, what condition has to be satisfied for the
range of function values f(p) over a three-dimensional domain
to be the same as the range over its boundary?
5. What is the range of the function g(x,y,z) = ax2
+ 2bxy + c2 + 2dyz + e2z2 + 2fzx?
(The answer will depend on the constants a, b, c,
d, e, and f
|
Slice Curves 1D 2D Cylindrical
Coordinates Spherical Coordinates
Parametric
Equations
Top of Page
Contents
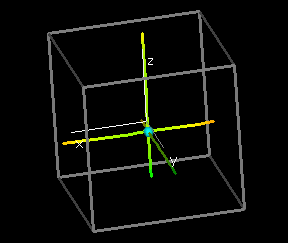
For every point (x0,y0,z0) in the
domain of a function f, the intersection of the graph of f with the
vertical plane x = x0, y = y0 will be the (x0,y0)-slice
curve (x0,y0,z,f(x0,y0,z)).
The domain of the x0-slice curve is the set of z for which (x0,y0,z)
is in the domain of f.
Similarly we define the (y0,z0)-slice curve to be
(x,y0,z0,f(x,y0,z0)) for
all x such that (x,y0,z0) is in the domain of f,
and we define the (x0,z0)-slice curve to be (x0,y,z0,f(x0,y,z0))
for all y such that (x,y0,z0) is in the domain of
f.
[D]
Exercises
|
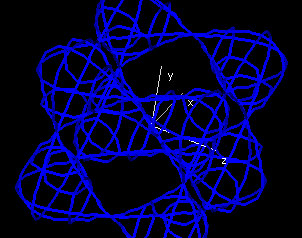
Type in the function f(x,y,z) = 2xyz/(x2 + y2
+ z2)
What happens to slice curves that pass through the origin? You may want
to change the resolution of the graph by increasing the number of x,
y, and z steps.
|
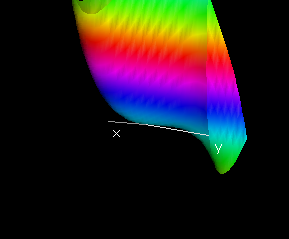
Slice Curves Along an Arbitrary Line 2D
Top of Page
Contents
[D]
Slice Surfaces Cylindrical
Coordinates Spherical
Coordinates
Parametric
Equations
Top of Page
Contents
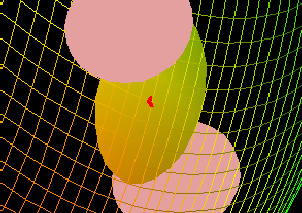
For every point (x0,y0,z0) in the
domain of a function f, the intersection of the graph of f with the
vertical hyperplane z = z0, will be the z0-slice
surface (x,y,z0,f(x,y,z0)). The domain of
the z0-slice surface is the set of (x, y) for which (x,y,z0)
is in the domain of f.
Similarly we define the y0-slice surface to be (x,y0,z,f(x,y0,z))
for all (x, z) such that (x,y0,z) is in the domain of f, and
we define the x0-slice surface to be (x0,y,z,f(x0,y,z))
for all (y, z) such that (x0,y,z) is in the domain of f.
Arbitrary Slice Surfaces
Level Sets & Contours 1D 2D Cylindrical
Coordinates Spherical Coordinates
Top of Page
Contents
The collection of all points (x,y,z) in the domain of a
function f for
which
f (x,y,z) = k is called the level set of f at level k.

The
level set of
f
is empty if there is no point (x,y,z) in the domain of f
for which f
(x,y,z) =
k. 
The set of points (x,y,z,f(x,y,z)) in the graph of f in
four-dimensional
space for which f(x,y,z) = k is called the contour of f
at height k.
A curve (x(t),y(t),z(t)) in the domain of f such
that f(x(t),y(t),z(t)) =
k is called a level curve of f at level k. A surface
(x(u,v),y(u,v),z(u,v)) such that f(x(u,v),y(u,v),z(u,v))
= k is called a
level surface of f at level k.
A Domain Color Graph in 3D 1D 2D Top of Page
Contents
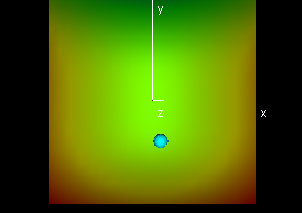
We can also construct a color graph of the function f
by assigning to each point (x,y,z) in the domain a color that
corresponds to the value f(x,y,z). 
In
a color graph, each point has
four coordinates. The first three are spatial coordinates and specify
the position of the point in space, and the fourth coordinate is
indicated by its color. 
Exercises
|
Use the tapedeck controllers to analyze the different level
sets of the function f. What can you say about critical
points of the hypersurface f(x,y,z)?
|
Continuity 1D 2D Top of Page
Contents
One of the most important properties of functions of two real variables
is continuity. The
basic intuition for continuity is that the range of a function f(x,y,z)
will lie in an arbitrarily small interval centered at f(x0,y0,z0)
if (x,y,z) is restricted to lie in a sufficiently small ball centered
at (x0,y0,z0). Geometrically,
this means that the graph of f(x,y,z) will lie between a pair of
parallel hyperplanes z = f(x0,y0,z0)
+ ε and z = f(x0,y0,z0) – ε if (x,y,z)
is required to lie in the ball of radius δ centered at f(x0,y0,z0)
i.e. √((x – x0)2 + (y – y0)2
+ (z – z0)2) < δ.
According to the epsilon-delta definition, a function f of
three real variables is said to be continuous at (x0,y0,z0)
if for any ε > 0 there exists a δ such that |
f(x,y,z) - f(x0,y0,z0) | < ε
whenever | (x,y,z) - (x0,y0,z0) |
< δ.
A function f of three real variables is said to be continuous if it is continuous at
all points (x0,y0,z0) in its
domain.
Exercises
|
For the function f(x,y,z)= x2+y2-z2,
set ε to 0.2, 0.1 and 0.05, respectively. Then for each of
these values of ε, find a value of δ that verifies
the continuity of the function.
|


