|
Total Mass of Regions between Function Graphs
Text As was true with simple regions, in order to find the total mass of a region between two function graphs, we must integrate the density function times some tiny volume dV over the given region. The difference here is in the limits of integration.
x and y will still begin and end at constants. The lower and upper limits of z, however, will be functions of x and y.
Demos
Total Mass

| 
|
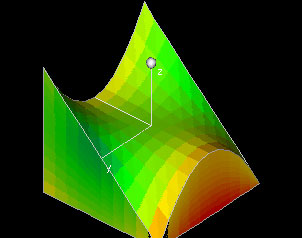
This demo shows a density function f(x,y,z) defined over a region in three-space, and it computes the total mass contained in the region. The region is bounded by the six surfaces x=a, x=b, y=c(x), y=d(x) q(x,y) and p(x,y), so you can change the region by entering different values for a and b, by entering different curves c(x), d(x) or by entering different surfaces p(x,y) and q(x,y). 
|
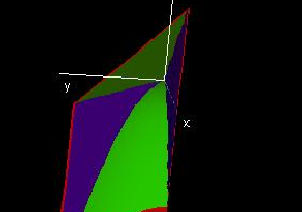
A region in 3-space
| 
|
This demo can serve as a tool for integrating over regions in three-space, more specifically it will help you to get the boundaries of triple integrals right - this can be rather tricky if you are changing the order of integration.
You can use the demo to visualize any three-dimensional region that is bounded by a particular kind of surface. (You will see when you open the demo.)
|
Exercises 1. How can you modify the problem of finding the mass of a region between two function graphs so that you only need to consider one function graph?
2. Find two functions of x, y, and z which enclose a region whose volume is finite (i.e. they intersect to form a closed surface).
|