|
Slice Curves & Surfaces
(Page: 1 | 2
| 3
) Text We begin the study of a function f of three variables x, y, and z in a rectangular domain by fixing two of the variables to produce a function of a single variable defined over an interval.
 If we fix y = y0 and z = z0, then the function f(x,y0,z0), called the x-slice function over y = y0, z = z0, is a function only of x defined on the interval a {leq} x {leq} b. Similarly if we fix x = x0 and z = z0, we obtain the y-slice function f(x0,y,z0) of the one variable y, defined over the interval c {leq} y {leq} d, and fixing x = x0, y = y0 gives the z-slice function f(x0,y0,z) of the variable z defined over the interval j {leq} z {leq} k.

The collection of points (x,y0,z0,f(x,y0,z0)) is the graph of the slice function over y = y0, z = z0, called the slice curve for y = y0, z = z0.
Similarly we define the slice curve for x = x0, z = z0 as a function of y, and the slice curve for x = x0, y = y0 as a function of z.
By fixing one of the three variables, for example z = z0, we obtain a function of the remaining two variables x and y. The graph of this function is called the z0-slice surface.
Similarly, we obtain the x0- and y0 slice surfaces through the point (x0,y0,z0).
Demos
Slice Curves
| 
|
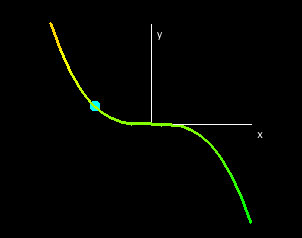
In this demo, we show the slice curves of the function f(x,y,z) = x2 - y3 + z5. The x-slice curve is the curve obtained by fixing y = y0 and z = z0, and it corresponds to the collection of points (x,y0,z0,f(x,y0,z) in 4-space. The graph of this slice depends only on one parameter, x, so it is a curve. In the X-Slice Curve window, we map this curve from 4-space into the collection of points (x,f(x,y0,z0) in the plane y = z = 0.
Similarly, we obtain the y-slice curve by fixing x = x0 and z = z0, and then projecting down into the plane x = z = 0; and we obtain the z-slice curve by fixing x = x0 and y = y0, projecting the curve into the plane x = y =0.
|
Exercises Type in the function f(x,y,z) = 2xyz/(x2 + y2 + z2) What happens to slice curves that pass through the origin? You may want to change the resolution of the graph by increasing the number of x, y, and z steps.
|