|
Slice Curves
(Page: 1 | 2
| 3
| 4
| 5
| 6
) Text We begin the study of a function f of two variables x and y in
a rectangular domain by fixing one of the variables to produce a function
of a single variable defined over an interval.
 If we fix y = y0, then the function f(x,y0), called the slice function over y = y0, is a function only of x defined on the interval a ≤ x ≤ b. Similarly if we fix x = x0, we obtain a function f(x0,y) of the one variable y, defined over the interval c ≤ y ≤ d.

Demos
Slice Curves at a Point
| 
|
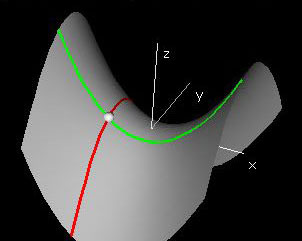
This first demonstration starts with the graph the function f(x,y) = x2 - y2 along with its x- and y-slice curves. In the control panel there are two tape decks that allow you to choose x0 and y0. Then, in the window labeled Domain, the lines (x0,y) and (x, y0) are drawn.
Under the function f(x,y), these two lines are mapped to the red and green slice curves that each appear in their own windows and on the surface itself. They are called slice curves because they can be thought of as the intersection of the function graph with vertical slicing planes. To view the vertical slicing planes, check the two Checkboxes marked (x,y0,z) and (x0,y,z).
The x- and y-slices are produced by slicing the function graph through the point f(x0,y0) along the x and y-directions, but in general, we can slice along any direction in the xy-plane.
|
Exercises Type in the function f(x,y) = 2xy/(x2 + y2) and investigate the slice curves at the origin. In particular, look at the x- and y-slice curves as well as the slices y = x and y = -x. What happens at the origin? You may want to change the resolution of the graph by increasing the number of x and y steps.
|