|
Constrained Maxima & Minima
Text A special case of the chain rule occurs when z(t) = f(x(t),y(t)) = c is constant.
 In that case, (x(t),y(t),c) is called a level curve of the function and (x(t),y(t)) is called a contour of the surface.
We then have
\begin{array}{rcl}
0 = (c)' = z'(t) & = & f_x(x(t),y(t))x'(t) + f_y(x(t),y(t))y'(t) \\
& = & \nabla f(x(t),y(t)) \cdot (x'(t),y'(t)) .
\end{array}

It follows that the gradient of a function of two variables at a point (x(t),y(t)) is perpendicular to the tangent vector to a level curve through the point.
If the gradient at a point is not the zero vector, then all tangent lines to level curves through the point will be parallel.
This follows since the intersection of the horizontal plane (x,y,c) and the non-horizontal normal plane will be a single line and all tangent lines to level curves at the point must lie in this intersection.
The highest point on the Massachusetts Turnpike is indicated by a
sign somewhere in the hilly region of Western Massachusetts.
This point will occur when the gradient vector of the turnpike's path is either the zero vector or when it is perpendicular to the turnpike's tangent vector.
In the first case, the turnpike's maximum height occurs at a critical point of the surface of Western Massachuetts.
In the second case, the turnpike's maximum height occurs when it is tangent to a contour line.
Demos
Highest Point on the Highway
| 
|
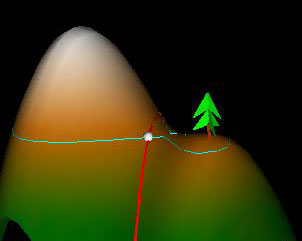
The function w(t) which represents the path of the highway is shown in the "Domain" window in red. In the control panel there is a tapedeck that allows you to change the variable t0 and travel along the highway. Two vectors are drawn at the point w(t0): the pink vector is the unit tangent vector to the red curve at w(t0) while the yellow vector is the gradient vector of f(x,y) at w(t0).
The default function f(x,y) produces a graph called "Twin Peaks" which can be seen in the 3D graph window. Under f(x,y), the red curve in the domain is mapped into a red curve on the surface. This "scenic highway" has z(t) = f(w(t)) as its height function. With this in mind, we ask the following question. As we travel along the highway, at what point do we attain our maximum height? The question is simpler in the case of a 2D graph. To find the maximum height of the graph of a function f(t), we would set f'(t) = 0, solve for t, and then check if the solutions were maxima or minima. This method naturally generalizes to 3D graphs as well. To find the maximum point along the highway, we set z'(t) = 0. Then, by the chain rule,
z'(t) = fx(x(t),y(t))x'(t) + fy(x(t),y(t))y'(t),
or
0 = ∇f(x(t),y(t))⋅(x'(t),y'(t))
This tells us that at the highest point w(t0) on the highway, the gradient vector at w(t0) must be perpendicular to the tangent vector at w(t0). Note that if the highway passes through a local maximum of the graph, then the gradient vector will be 0 and will automatically be perpendicular to the tangent vector.
|
Exercises 1. Use the tape deck for the variable c to determine the highway's highest point. How are the path's tangent vector (light grey) and the surfaces gradient vector (yellow) related, as seen in the "Domain" window? At what angle is the gradient slice curve (yellow) cutting the curve (red) on the surface, as seen in the "Scenic Highway" window?
2. Try entering w(t)=(t,t) and determine the highest point on the highway for this new path. What happens to the gradient vector (yellow) at the highest point? What happens to the gradient vector on either side of the highest point? What kind of critical point is this? Why?
|