Volume Under a Function Graph
(Page: 1 | 2
) Text For a functions of one variable, a definite integral represents the area underneath its two-dimensional
function graph. Likewise, the definite integral of a function of two variables represents the volume underneath its
three-dimensional function graph.
Recall that the procedure for evaluating single variable integrals is to
1. approximate the area under the graph using rectangles; and
2. take the limit of the sum of the area of these rectangles as the number of rectangles approaches
infinity.
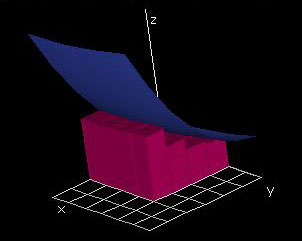
Similarly, the volume underneath the function graph for a double integral can be found by
1. dividing the domain R into rectangles;
2. erecting rectangular prisms over these rectangles using the value of the function graph at the
bottom-left vertex of each rectangle as the height;
3. taking the limit of the sum of the prisms� volumes as the number of rectangles in the domain
aproaches infinity.
Mathematically, this can be stated
\[ \int_R\int f(x,y) dA = \lim_{\|\Delta\| \to 0} \sum_{i=1}^n f(x_i,y_i)\Delta x_i \Delta y_i .\]
Demos
Approximation by Rectangular Prisms
| 
|
In this demo, rectangular prisms are used to approximate the volume underneath a function graph. Here we show the so-called lower sum: The top faces of the prisms are all horizontal, and their height zij is given by the lowest value f attains on the corners of the prism. Note that unless the base of a particular prism contains a critical point, this is also the lowest value f attains over all of the base. Thus, the sum of the volumes of all the prisms is always less than the actual volume under the function graph, no matter what resolution you choose.
The domain is a rectangular domain of the form a ≤ x ≤ b, c ≤ y ≤ d. The initial values are set to a = c = 0, b = d = 1. You can change the domain into any rectangular domain by adjusting the values for domain and domainy.
The "res" and "step" variables are controlled by "tape deck" controllers. The "step" variable controls in increments of one sixth how much of the graph is filled in. The "res" variable controls the number of subdivisions in the approximation. You can increase the number of subdivisions to observe that the finer the subdivision, the closer the approximation gets to the actual value of the volume integral. Selecting a "res" value greater than 18 is not recommended on slower machines.
Note that this demo does not examine the case that the step/res values of x and y change separately. This feature is purposely left out until lab 2.4.4, which discusses the order of integration.
|
Exercises 1. For which of the following two functions is the lower sum a better approximation for the domain 0 ≤ x ≤ 1, 0 ≤ y ≤ 1? Explain your answer.
- f(x, y) = x2 + y2
- f(x, y) = -(x2 + y2)
2. What would happen if there were a large number of subdivisions (approaches infinity) along the x-axis and a small number of subdivisions along the y-axis? How could you go about finding the sum of the volumes of the rectangular prisms? What if instead there were a large number of subdivisions along the y-axis and a small number of subdivisions along the x-axis?
|