|
Introduction
(Page: Demo Tutorial | Functions
) Text DEMO TUTORIAL
This tutorial is divided into five lessons.
To view a lesson, click on the [+] button above its picture and then click the button that appears.
A more detailed demo tutorial is located in the Resources section.
Demos
Lesson 1: Viewing a 3D graph

| 
|
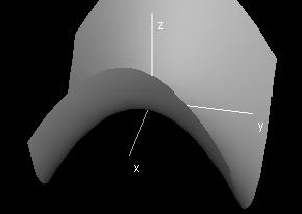
This demo includes two windows: a control window (which contains the equation for f(x, y) in this case) and a 3D graph window. You may find it useful to adjust the size of the graph window.
Once you are comfortable with the window size, you can rotate, translate, or zoom in or out to change your view of the 3D graph.
To rotate, select Rotate from the Tools menu or hold down Control (hold down [Apple] if you are using a Mac). Now, click and drag the mouse in the direction you want the part of the graph closest to you to move.
To translate, select Translate from the Tools menu or hold down Alt. Click and drag in the direction you want to translate the graph.
To zoom, select Zoom from the Tools menu or hold down Shift. Click and drag upward to zoom in or drag downward to zoom out.
To return to the default view, press [space bar].
There are six other preset viewing angles under the View menu, each from some position on one of the axes. The shortcut keys for these views are x, y, z, shift-x, shift-y, and shift-z. The shift button gives you a view from a point on the negative-valued part of the axis. Otherwise, the view will be from a positive-valued point.
When you are finished using the demo, you can exit by closing the control window or by selecting Exit Demo from the Demo menu in the control window. 
|
Lesson 2: Using the Control Window
| 
|
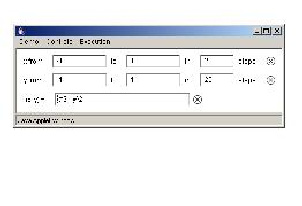
The control window in this demo includes three elements: the intervals x and y and the function f(x, y).
Each time you change the information in a text box in the control window, you must press Enter for the change to take effect.
For example, suppose you wanted to view the graph from x = -1 to 2 instead of -1 to 1. To do this, you would type in "2" in the text box for the upper bound of x and press Enter.
In this demo, you have the option of changing the bounds on x and y, the resolution for x and y, and the expression for the function f(x, y). (See EXAMPLES at the bottom of this page for a list of some useful built-in functions.)
To save the altered demo (don't worry, this won't overwrite the old one), select Show Applet Tag under Demo in the Control Window. Copy the HTML code that appears, and paste it in your response to a homework assignment or discussion. This will create a button in your response that leads to your version of the demo.
|
Lesson 3: Variables and expressions
| 
|
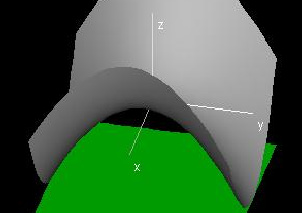
In these demos, an Expression can be assigned a constant or variable value and can then be used in any formula or plot in the demo. The example used here is called "a", and it represents the magnitude of a vertical stretch of the graph. Try changing its value. You can change it to any number or to any expression involving c, the only variable used in this demo.
Variables in these demos, like intervals, are given minimum and maximum values. Instead of having resolution, however, variables have "steps". If you started a variable at its minimum value, the amount of times you would have to press the ">" button to get to the maximum value would be equal to the number of steps for the variable.
Just as the ">" button increases the variable value by one step, the "<" button decreases the value by one step.
To see an animation in which the variable value keeps increasing or keeps decreasing until it reaches its upper or lower bound, use the ">>" or "<<" button.
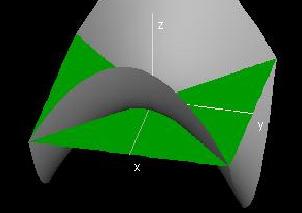
In this example, the variable c represents the altitude of the green plane in the 3D Graph window.
|
Lesson 4: Adding elements to a demo
| 
|
This demo starts out blank. The lesson explains how to add in the elements you have seen so far.
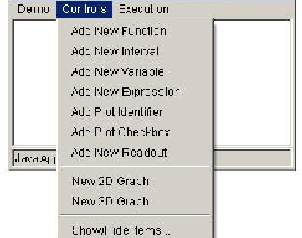
To add an expression, select Add New Expression from the Controls menu, and enter the expression in the form
name = value (e.g. a = 1).
Once you have done this, click OK (or press enter).
To add an interval, select Add New Interval from the Controls menu. You will be asked to enter the name, minimum value, maximum value, and resolution for an interval, in this form:
name of interval = #, #, #
and click OK.
For example, if you were trying to recreate the previous demo, you would first add the interval x by typing "x = -1, 1, 20" and then add the interval y by typing "y = -1, 1, 20".
To add a new variable, select Add New Variable from the Controls menu and enter the variable name, minimum and maximum values, and steps, in this form:
variable name = #, #, #
and click OK.
To add a function, select Add New Function from the Controls menu and enter a function in this form:
name of function(independent variable(s)) = expression
click OK when you are finished.
Note that you must use "*" for multiplication and "^" for exponents. For example, for the product xy, you need to type "x * y".
To recreate the function from the previous demo, type "f(x,y) = x^2 - y^2"
Now under Controls, select New 3D Graph.
Go to Plot >> Add Plot >> Surface
In the box where it asks you to enter a parametric surface, type in expressions for x, y, and z, separated by commas. For example, you could type x, y, f(x, y) to get the function graph of f(x, y).
You can change the color by clicking on the box that starts out with a green bar, clicking "Edit Color", and selecting the desired color of the surface.
If you want the surface to look like the one from the previous demo, change the surface from green to light gray, and select Filled Surfaces, No Lines from the Style menu of the 3D Graph window.
To get a demo that starts out blank (making sure to save first if you want to keep your demo), you would select New Demo from the Demo menu in the control window of any existing demo.
|
Lesson 5: Using Hotspots
| 
|
A hotspot is a movable point on one of the graphs of the demo whose coordinates can be used to affect other parts of the demo.
For example, the point on the 2D graph in this demo is a hotspot. It is constrained to lie on the line segment shown. Click and drag the hotspot up and down to change the altitude of the green plane in the 3D graph window.
The way to use a coordinate of a hotspot as a value in another part of the lab is to type (name of hotspot)_1 for the x-coordinate and (name of hotspot)_2 for the y-coordinate. For example, the hotspot in this demo is called C, and the parametric expression given for the green plane is x, y, C_2.
Adding a hotspot is a bit more involved than adding most other types of elements. To add a hotspot:
- Create the graph window where you want the hotspot to be located.
- Create the plot to which you want to constrain the position of the hotspot. This could be a parametrized curve or surface, for example. To create a simple slider bar, you might enter the parametrized curve (0, k), where k is an interval that goes from -1 to 1.
- Go to Edit Hotspots under the Window menu.
- Click on the Add Hostpot button.
- Enter the name of the hotspot in the first textbox.
- In the second textbox, enter the starting position of the hotspot. Make sure this position is located on your plot.
- In the third box, select "Plot", and then choose the plot to which you want to constrain the hotspot.
- Finally, go to Plot >> Add Plot >> Point and instead of typing in coordinates for the point, just type in the name of the point. The hotspot should appear on the graph.
An alternative way to set constraints for hotspots is to enter an expression for the boundary of the hotspot. "Clamp(lower bound,upper bound)" followed by "{Point_#}" is used to keep a coordinate of a hotspot between two expressions. For example, clamp(0, 1){Point_1},clamp(0, 2){Point_2} would limit a hotspot to a rectangle with 0≤x≤1 and 0≤y≤2.
|
Examples Built-in Functions
- sin(x), cos(x), tan(x)
- asin(x), acos(x), atan(x) (arcsin, arccos, arctan)
- f'(x) (derivative of f(x) with respect to x)
- f_x(x, y) (partial derivative of f(x, y) with respect to x)
- f_x_x(x, y), f_y_x(x, y), etc. (second partial derivatives)
- integral(integrand, variable, lower, upper) (integral of integrand with respect to variable from lower to upper - e.g. for ∫01x2dx, type integral(x^2, x, 0, 1).)
Exercises 1. Create a new demo by following these steps:
- Add intervals x and y, both of which go from -1 to 1 in 20 steps.
- Add variables a and b, which go from -1 to 1 in 10 steps.
- Add a function f(x, y), and type in any expression for it.
- Add a 3D graph window which shows the function graph of f(x, y) and plots the point (a, b, f(a, b)).
2. Create a demo which shows a graph of the function f(x) and also graphs the tangent line to f(x) at some point, x0.
3. Create a demo based on your favorite calculus topic.
|