|
Level Sets & Contour Lines
(Page: 1 | 2
| 3
) Text The collection of all points (x,y) in the domain of a function f for which f(x,y) = c is called the level set of f at level c. The level set of f is empty if there is no point (x,y) in the domain of f for which f(x,y) = c. If (x(t),y(t)) is a curve in the domain of f such that f(x(t),y(t)) = c is constant, then the space curve (x(t),y(t),c) is called a level curve of f. The plane curve (x(t),y(t)) in the domain of f is called a contour.
Demos
Level Curves

| 
|
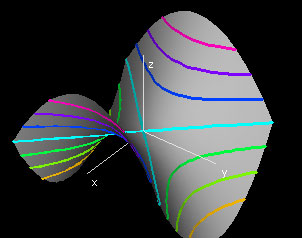
This demo shows some level sets for the function f(x,y)= x2 - y2. The level sets consist of level curves f(x,y) = c, and you can view them on the function graph in the "Function Graph: f(x,y)" window.
In the "Domain: f(x,y)" window, we show the level curves projected down into the xy-plane without actually displaying the function graph. This is called a "contour map", and it will prove to be very useful to look at in analyzing function graphs of functions f depending on more than two variables.
Actually, it is quite possible to view contours without being able to look at the graph itself, and this can already give a lot of information about the function. (Check out the corresponding lab for three dimensions!!)

|
Examples Contours of Linear Functions
The contour of the linear function L(x,y) = px + qy + k at level c is the collection of (x,y) in the plane such that px + qy + (k - c) = 0. If L is not a constant function, then this contour is a straight line in the plane. The level curve of f at level c will be the collection of points (x,y,c) where L(x,y) = c.
Contours of @f(x,y) = x{^2} + y{^2}@
Exercises 1. Describe the contours of the function . What about the function f(x,y) = sin(x2 + y2)?
2. Describe the contours of the function f(x,y) = x2 - y2. The graph of this function is called a saddle.
3. Describe the contours of the function f(x,y) = x2 +Bxy + y2 for various values of B. For which B will there be a level set consisting of just one point?
4. Describe the contours of the function f(x,y) = x3 - 3xy2. (The graph of this function is called a monkey saddle.)
5. Describe the contours of the function f(x,y) = -x4 + 2x2 - y4 + 2y2.
6. Analyze Crater Lake shifted by an earthquake, with function f(x,y) = -(x2 + y2)2 + 2(x2 + y2) + mx for various values of m. For which m will the lake no longer hold water? Describe the critical levels, i.e. the level sets that contain critical points.
|